During the winter, UKHSA and the Met Office work together to issue Cold-Health Alerts (CHAs) if the weather is cold enough that it has the potential to affect people’s health.
The annual ‘Cold mortality monitoring report’ provides information on deaths during cold episodes each year to inform public health actions. The statistics show the number of cold-associated deaths, both for the total impact of cold and for the direct impact of cold independently of impacts on influenza circulation. The total cold-associated deaths are also broken down by age, sex, region, cause of death and place of death. The report also discusses the timing of cold-associated deaths, and compares the cold-mortality relationship in the latest 5 years with a previous 5-year period.
The UK Health Security Agency (UKHSA) has published its first Cold Mortality Monitoring Report, providing new estimates of deaths associated with cold weather in England during winter 2024 to 2025.
Findings from the report show that 2,544 deaths were associated with cold weather across 3 cold episodes recorded between November 2024 and January 2025. The most severe episode, a 6-day period in early January, accounted for 1,630 deaths, while shorter episodes in November and early January were associated with 421 and 493 deaths respectively.
Other key findings from the report include:
- older people were most affected, with the risk rising steeply with age, especially in those aged 85 and over
- men had a higher number of cold-associated deaths (1,439) than women (1,117)
- circulatory diseases caused the highest number of cold-related deaths, with 834 deaths linked to conditions such as heart disease
- most deaths (975) happened in hospitals, although the increase in risk during cold weather was greater for people in care homes and those who died at home
The report found that mortality peaks around 5 days after cold weather and remains elevated for up to 9 days. Heart-related deaths tend to increase several days after cold exposure, while respiratory and infection-related deaths show longer delays.
A cold episode is defined as a period of 2 or more consecutive days where the average daily mean temperature across England was below 2°C. This is in line with the temperature threshold for issuing a yellow Cold Health Alert (CHA).
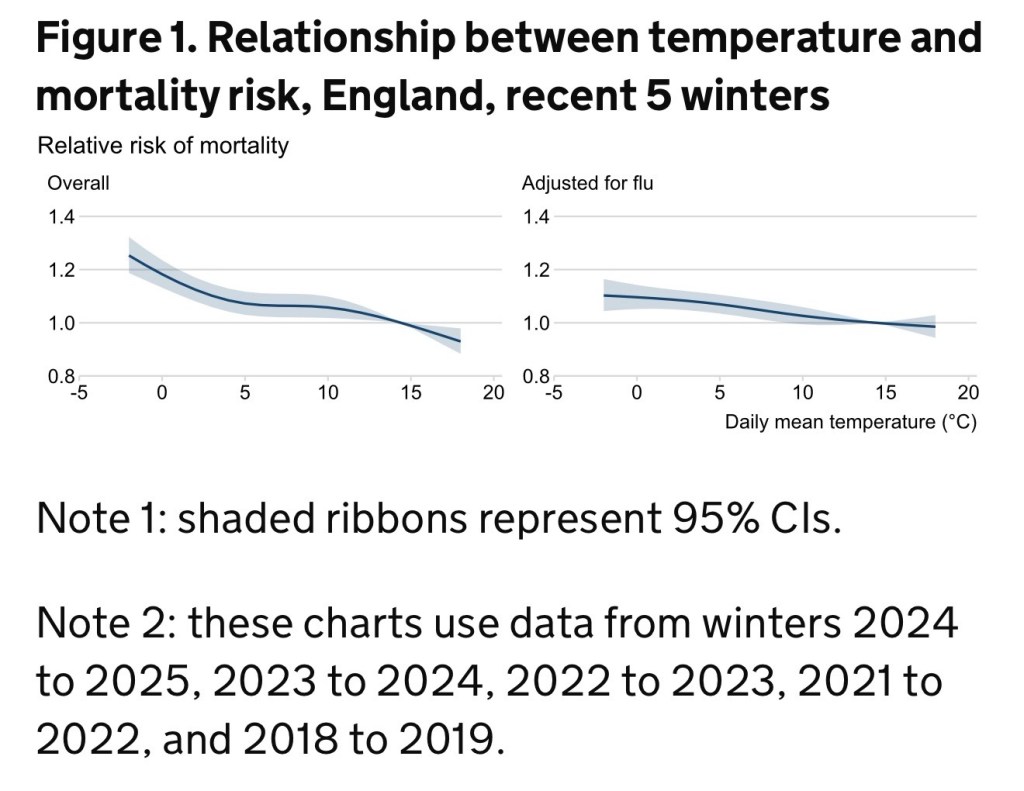
Figure 1 shows the modelled relationship between temperature and mortality, for the total impact of cold (first chart) and the direct impact of cold after adjusting for influenza (second chart). This is based on deaths from all causes over the most recent 5 winters, excluding winters 2019 to 2020 and 2020 to 2021 due to the impacts of the COVID-19 pandemic on mortality.
The figure shows the estimated mortality risk at different temperatures. This represents how the chance of dying changes as a result of cold temperatures compared with a reference temperature of 14.4°C, taking account of delayed effects and immediate effects. A relative risk (RR) of 1.0 means no increase in risk compared to the reference temperature, 1.1 means a 10% higher risk, 1.2 means a 20% higher risk, and 1.4 means a 40% higher risk.
For the overall impact of cold, the mortality risk increases with colder temperatures. It increases particularly quickly when temperatures fall below 5°C. For the direct impact of cold after adjusting for influenza, mortality risk also increases with colder temperatures, but more gradually.
The relationships shown in Figure 1 are then used to estimate the number of deaths associated with each cold episode in winter 2024 to 2025, taking account of the actual observed temperatures in each episode. See our Data sources and methodology section and QMI report for more detail.
In winter 2024 to 2025, there were an estimated 2,544 (95% CI: 1,965 to 3,131) cold-associated deaths in total. A total of 1,448 (95% CI: 799 to 2,172) of these deaths were directly associated with cold weather, independent of influenza circulation. The remaining 1,095 of these deaths were linked to cold weather causing increases in influenza infection.
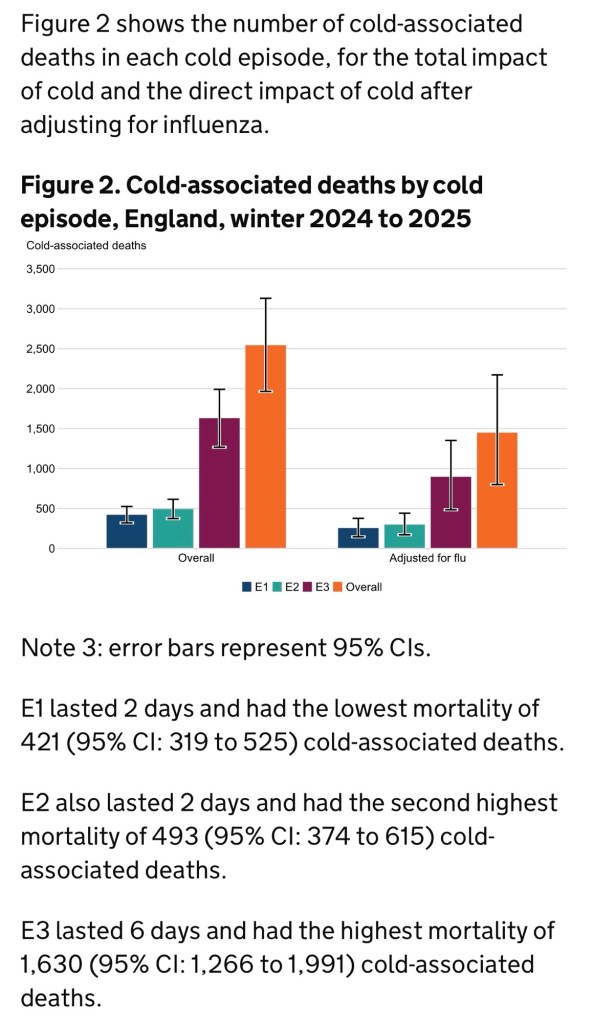
Table 1 in the accompanying spreadsheet shows cold-associated deaths and cold-associated deaths per day by cold episode, for the total impact and the direct impact after adjusting for influenza.
The method used for the overall cold-associated mortality was then applied to specific groups of deaths, to provide breakdowns by region, age, sex, place of death and cause of death. Results are presented in the following sections.
Cold-associated mortality by region
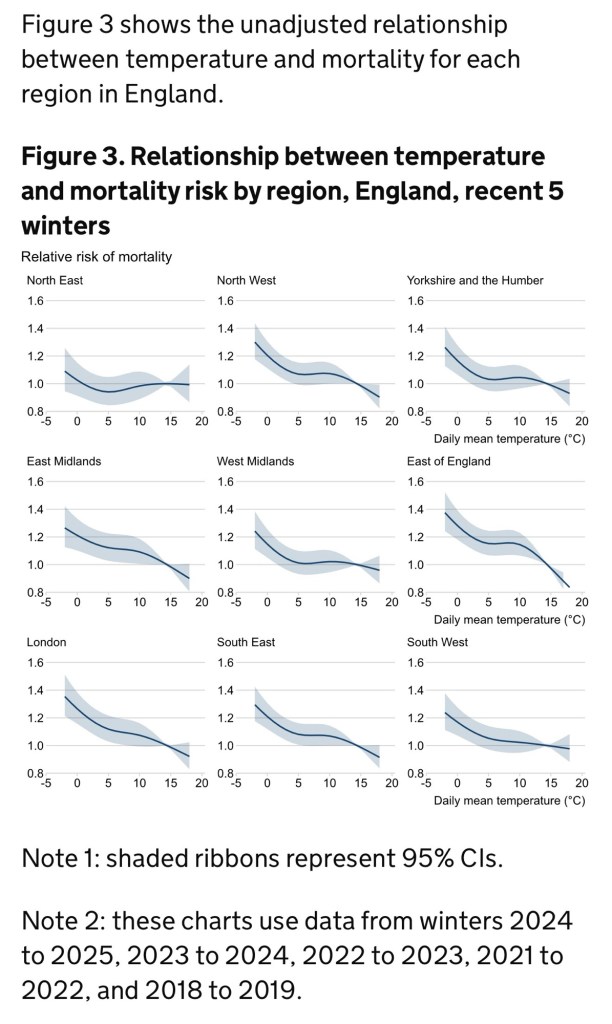
Figure 3 shows the unadjusted relationship between temperature and mortality for each region in England.
Most regions showed a similar pattern, with higher mortality risk at lower temperatures, particularly below around 5°C. The North East showed an unclear relationship with a similar risk of mortality across the temperature range. This may be related to the smaller population in the North East increasing uncertainty in the modelling, or may reflect a genuine difference in risk.
Applying the model to winter 2024 to 2025, the South East had the highest number of cold-associated deaths over the winter of 471 (95% CI: 303 to 636). Figure 4a shows the number of cold-associated deaths by region and cold episode.
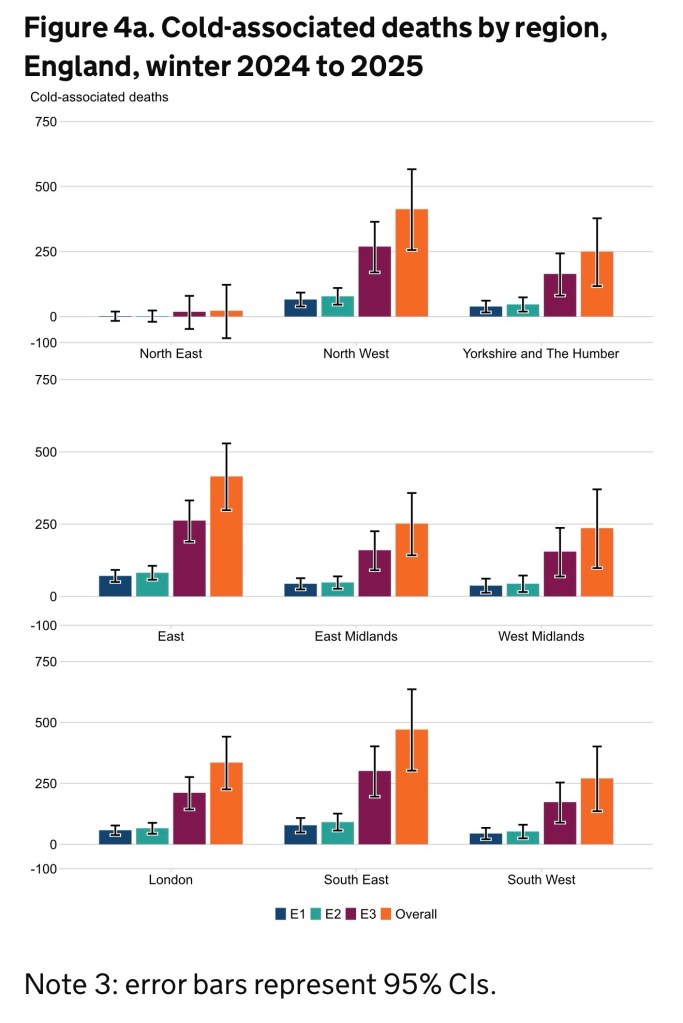
Statistically significant cold-associated mortality was also seen in all regions except the North East. (See our Data sources and methodology section for how we define statistical significance.)
When adjusting for population size, the East of England had the highest mortality rate of 63 (95% CI: 45 to 80) cold-associated deaths per million population, followed by the North West and East Midlands. Figure 4b shows the rate of cold-associated deaths per million population by region, combining all 3 cold episodes.
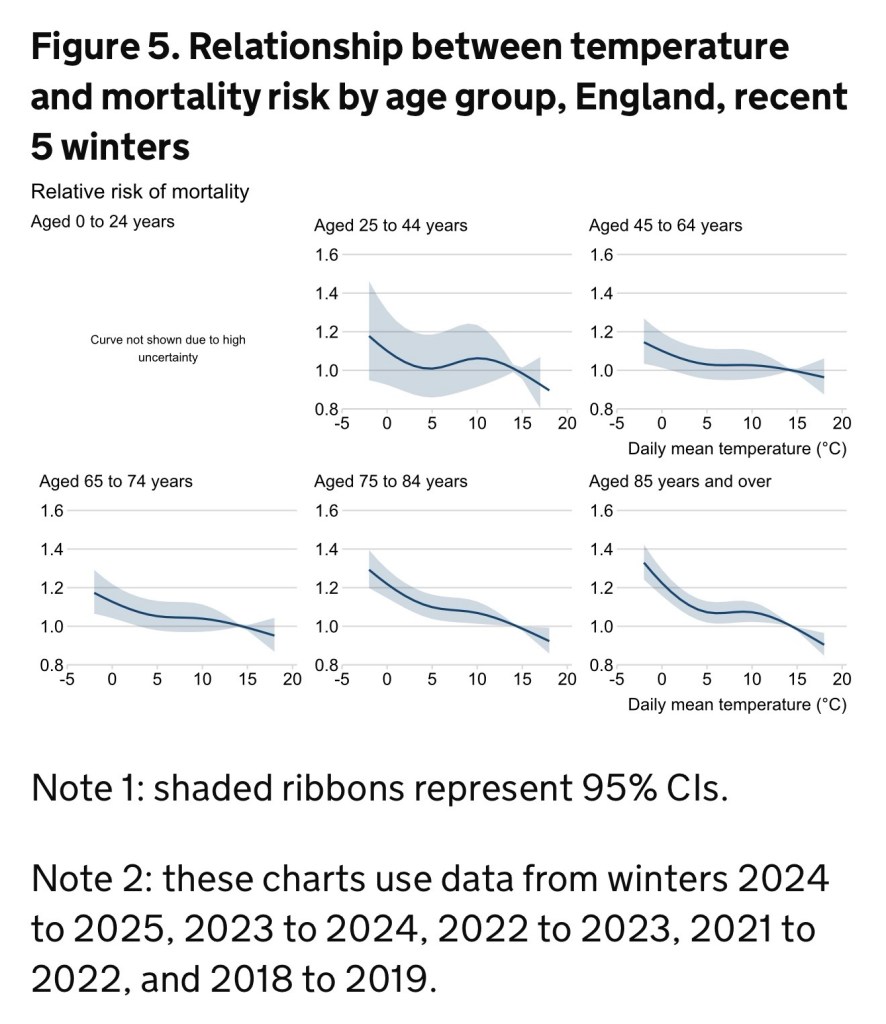
The strongest relationship between cold weather and mortality was seen in those aged 85 years and over. Deaths in this age group increased with colder temperatures, and increased more rapidly below 5°C. Deaths in those aged 75 to 84 years, aged 65 to 74 years and aged 45 to 64 years also followed this pattern, though more gradually. The relationship was less clear in those aged 25 to 44 years, where there is greater statistical uncertainty due to fewer deaths in this group.
Applying the model to winter 2024 to 2025, those aged 85 years and over had the highest cold-associated deaths. Figure 6 shows the number of cold-associated deaths by age group and cold episode.
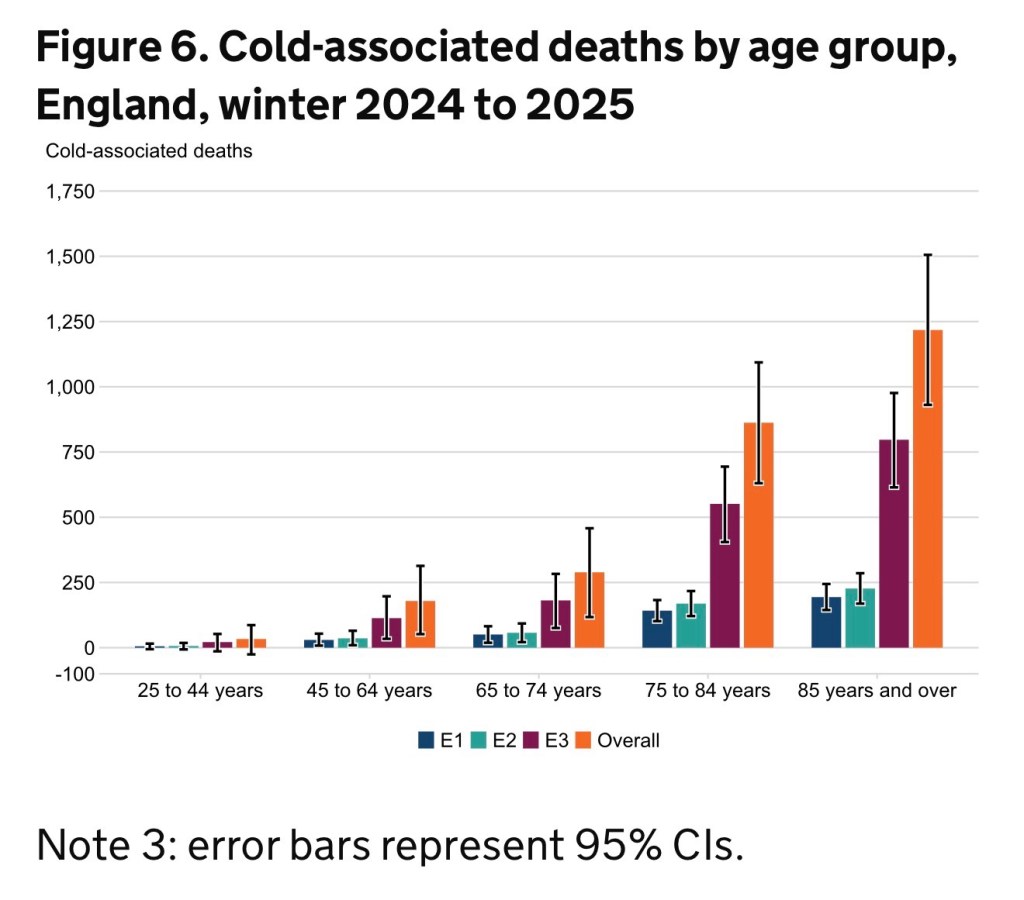
Significant cold-associated mortality was also seen in those aged 45 to 64 years, aged 65 to 74 years, and aged 75 to 84 years.
Source:
