How medicine and healthcare affect us in the smallest of ways leading to bigger impacts and life-changing consequences! Ultimately, changing what we call ‘healthcare.’
Researchers from the Department of Clinical Medicine at Aarhus University have been able to demonstrate for the first time that the memstrual cycle affects a plethora of proteins in the female body. This is explored by one of the leading researchers who is behind the study – Jonas Ghouse. This study is published in the journal Nature Medicine.
“The study shows that the body’s building blocks—proteins, change to a far greater extent during the menstrual cycle than previously recognized,” he says. Researchers have identified close to 200 proteins that change in its entirety throughout the menstrual cycle.
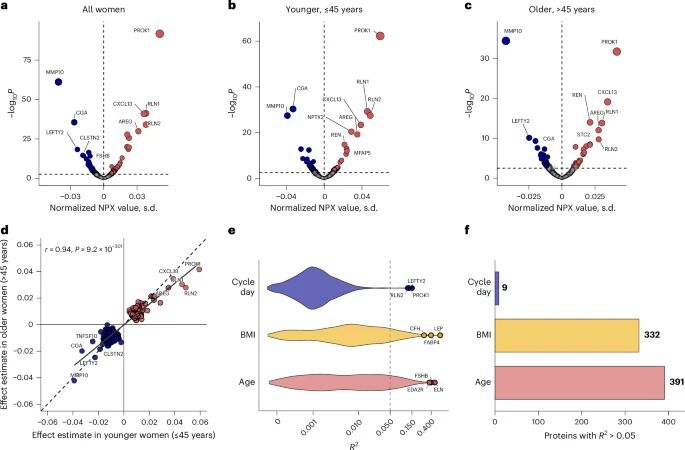
Several of these proteins are found to have been linked to conditions such as ednometriosis, uterine fibroids, and bleeding disorders. Nearly 3,000 plasma proteins from 2,760 women’s health data from the UK Biobank were profiled on and 198 varying proteins across the menstrual cycle were identified. This study was carried out in younger and older women. These formed distinct temporal patterns that aligned with their corresponding menstrual phases. These proteins include reproductive hormones, cytokines and growth factors, many of which are enriched in endometrial tissue and expressed in epithelial and stromal cell types, highlighting their biological specificity. Several proteins were linked to common reproductive disorders, including endometriosis, leiomyoma and abnormal bleeding. Finally, we developed a proteomic score on the basis of 75 proteins that accurately predicts menstrual cycle phase.
These findings can help provide a menstrual cycle atlas on a systematic level and keep informed of biomarkers essential to a women’s health.
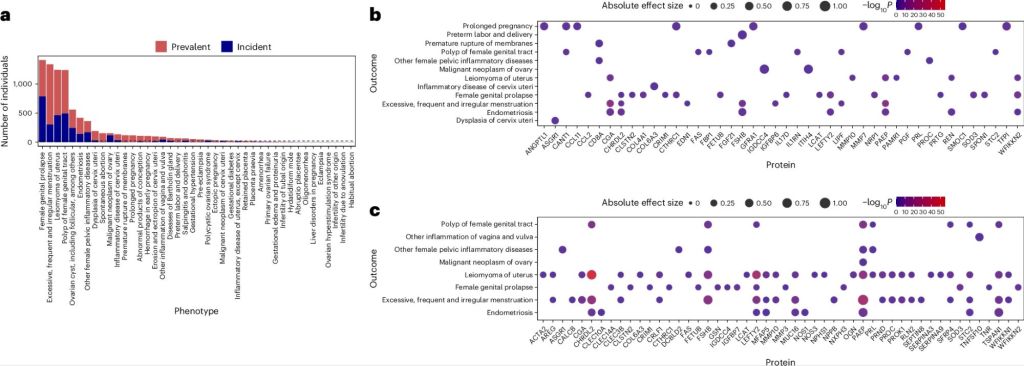
a, A volcano plot of associations between circulating protein levels and menstrual cycle day in all women (N = 2,760). b, A volcano plot in women ≤45 years (N = 1,421). c, A volcano plot in women >45 years (N = 1,339). In a–c, each point represents one protein, with the x axis showing the normalized protein expression (NPX) value (s.d. units) from the linear regression model and the y axis showing the −log10 P value (two-sided). The red points indicate proteins positively associated with cycle day, and the blue points indicate proteins negatively associated with cycle day, at an FDR < 0.05. P values were corrected for multiplicity using Benjamini–Hochberg correction. Analyses were adjusted for age, BMI, smoking status, self-reported ancestry, time between blood draw and proteomic measurement, and batch. Top associations are annotated on the plot. d, A comparison of effect estimates for protein–cycle day associations between younger and older women. Each point represents a protein, with x- and y axes showing the estimated regression coefficients in younger and older women, respectively. The dashed line indicates the reference line, and the solid line represents the fit linear regression. e, The distribution of variance explained (R2) by cycle day, BMI and age from separate natural cubic spline models. The dashed line marks R2 of 0.05. The points and labels denote the top five proteins per predictor. f, The number of proteins with R2 > 0.05 from the same spline models.a, The distribution of prevalent (red) and incident (blue) diagnoses among women in the UKB cohort with available proteomics data (N = 23,674). b, Protein-prevalent disease associations (FDR < 0.05) across 12 reproductive health conditions. The dot size indicates absolute effect size (logOR per s.d. increase in protein level), and the colors represent −log10P (two-sided). c, The protein–incident disease associations (FDR < 0.05) across eight conditions, with dot size and color as in b. In b and c, protein–disease associations were estimated using logistic regression models adjusted for age, BMI, smoking status, self-reported ancestry, time between blood draw and proteomic measurement, and batch. P values were corrected for multiplicity using Benjamini–Hochberg correction.